
Misinformation

Countering Misinformation
Why Misinformation Happens
Climate change misinformation arises not from a single source, but from a complex web of motives and misunderstandings. On one hand, there are deliberate efforts—often capital-driven—to sow doubt and delay climate action for financial or political gain. These campaigns target uncertainty in public discourse, exploiting the natural complexity of climate science to erode trust and manufacture confusion. On the other, many individuals simply inherit secondhand narratives shaped by busy lives, inaccessible data, or a media ecosystem that favors conflict over clarity.
This dynamic results in a spectrum of misunderstanding. Some are misled by outdated or misleading sources, others by ideology wrapped in pseudoscience. But perhaps the most widespread challenge is passive inaction—people who accept the science but don’t act on it. This non-participation, a form of practical denial, shows how misinformation is not only about falsehoods, but also about distractions, delays, and disengagement from responsibility.
Media Literacy
The Role of Media Literacy
In a world where information moves faster than ever, media literacy is no longer optional—it’s essential. The ability to critically evaluate sources, spot manipulative framing, and trace claims back to credible evidence is vital to countering misinformation. For climate issues in particular, media literacy allows individuals to navigate between rigorous science and agenda-driven spin, empowering them to act on truth rather than fallacy.
Media literacy also invites a more democratic form of participation. When people are equipped to discern fact from fiction, they’re better able to hold leaders accountable, engage in meaningful conversations, and resist the paralysis that comes from overwhelming or contradictory narratives. It’s not just about knowing what’s real—it’s about cultivating the confidence to respond with purpose and clarity.
‘Combatting Climate Disinformation on Social Media’ –Union of Concerned Scientists, 2021
Resources

SkepticalScience – a valuable source of information on various climate issues, particularly useful for debunking climate denier myths.

A Waning Warming
A response to the claims that global warming has stopped by Alan Journet.
SOCAN Archive
A Response to Reports Claiming to Contradict the Climate Science Consensus Alan R.P. Journet Ph.D.
Southern Oregon Climate Action Now (https://socan.eco) [email protected]; 541-301-4107
In evaluating reports that purport to counter the scientific consensus that global warming and its climate change consequences are happening, those who don’t pay constant attention to the wealth of evidence addressing a myriad of impacts can be influenced by reports that cherry pick small subsets of data addressing one issue, particularly recent such data subsets. For example, if we look at the snowfall events at Crater Lake (Figure 1) taken from National Park data, we will see considerable variability. Indeed, we could take a three-year period in the middle of the last decade and conclude rising snowfall. However, if we conduct a regression analysis over the complete data set to discern the overall trend (Figure 2), it appears clear that we are seeing a substantial trajectory of reducing snowfall.


In fact, the overall trend is a reduction broad picture. We must not overlook the forest as we focus on individual trees. Natural systems are inherently quite variable, so we don’t expect to see every year follow the overall trend.
Before drawing conclusions from apparent of 2.5866 inches per year with a reduction of some 200 inches (over 16 feet) during the 9 decades. It is important always to step back and assess the short-term trends in data, it is also important to understand fully the underlying science.


In the arctic, ice variables peak at the end of winter, in March, and trough at the end of summer, in September. As the source notes, sea ice extent is not a very useful measure of climate trends. This is because sea ice extent is determined not as ocean covered by a solid ice sheet but as that area which is occupied by at least 15% ice cover.


A moment of reflection will reveal that if land born or shelf-ice sheets are breaking up, there will be more pieces of ice floating on the surface of the ocean and likely spreading out. Thus, in a warming environment, the sea ice extent may well exhibit an increase especially if an ice shelf off Greenland or Antarctica breaks off and breaks up. Certainly, mass and volume are better measures. However, the long-term trend in Arctic sea ice extent from the National Snow and Ice Data center is revealing (Figure 3 http://nsidc.org/arcticseaicenews/2020/10/). The data for 2020 are obviously the second lowest on record and the overall trend is unequivocal.
It is also important to understand what is happening to the age of Arctic ice. As can be seen in Figure 4
(http://nsidc.org/arcticseaicenews/2022/05/springtime-in-the-arctic/. Four decades ago, over 30% of the ice was 4 years or older while

less than 40% was under a year of age. By 2021, the older ice had dwindled to less than 5% and the young ice increased to over 60%. It is evident that the ice is simply not exhibiting the kind of extended duration it previously exhibited. Acknowledging that ice volume or mass might be a better measure of trends, let’s look at Arctic ice volume which depicts a clear downward trend over four decades. It is certainly difficult to conclude other than that Arctic ice is on a consistently decreasing trajectory (https://tc.copernicus.org/articles/14/1325/2020/#&gid=1&pid=1 ).
Indeed, the evidence suggest that the rate of decline is faster than models have predicted. This represents one line of evidence dispelling the claim that models exaggerate how alarming the expected trends will be. As long ago as 2010 it was clear that the actual trend was more pronounced than the models suggested they would be. Figure 6
(http://nsidc.org/arcticseaicenews/2012/08/a-most-interesting-arctic-summer/figure5-8/) depicts the actual trend (black) and the model trends (Blue and Red).
It is critical to appreciate that the Arctic and Antarctic are very different in that, except for Greenland, the Arctic ice is floating, whereas Antarctic ice is largely born on the huge land mass of continental Antarctica which is over 3,000 miles across at its widest point and 1.5 times the area of the U.S. (Figure 7 https://www.techexplorist.com/new terrain-map-of-antarctica-accurately depicts-continent-in-stunning-detail/16868/)


East Antarctica

West Antarctica – Figure 7
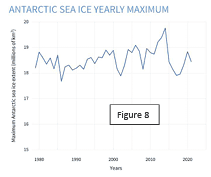
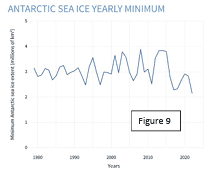
With a cycle opposite to the Arctic pole, the Antarctic sea ice extent peaks in mid to late September, and troughs in late February to early March (https://www.climate.gov/news-features/understanding climate/understanding-climate-antarctic-sea-ice extent#:~:text=Antarctic%20sea%20ice%20usually%20reaches,is%2015%20percent%20or%20hi gher). While the September 2021 peak was well above average, it dropped off rapidly during the month so September as whole was about average. Then, the late February minimum, was the lowest on record. This is another example of why looking at, and cherry-picking, single datum points or a few points can lead to grossly erroneous conclusions.
The long-term trends in Antarctic sea ice extent for the maximum (Figure 8) and minimum (Figure 9) indicate variability, but overall no profound trend. Meanwhile, Antarctic sea ice extent is again reported in August, as we approach the 2022 maximum, to be persisting at record low levels (http://nsidc.org/arcticseaicenews/).
Antarctic sea ice extent is again reported in August, as we approach the 2022 maximum, to be persisting at record low levels (http://nsidc.org/arcticseaicenews/).
It is worth asking what would be likely to happen to sea ice extent if the land-born Antarctic ice were sliding into the ocean. The answer is that warming might well cause sea ice extent to expand. So, let’s ask what is happening to that land-born ice.
Because Antarctic is such a large continent, climate responses are assessed in three regions: East Antarctica, West Antarctica, and the Antarctic Peninsula (see Figure 7). An assessment of ice mass was published in 2019 and revealed the patterns depicted in Figure 10. Note that both West Antarctica and the Peninsula are exhibiting ice mass reduction while East Antarctica is experiencing an increase. The net overall result is an Antarctic ice mass decline.
Meanwhile, analyses of the discrepancy between model expectations of Antarctic sea ice extent declining and the observed pattern suggest a combination of factors that are not included in standard climate models including wind and sea ice drift combined with the impact of upwellings of deep sea cold ocean currents (https://eos.org/science-updates/new-perspectives-on-the-enigma-of-expanding-antarctic-seaice).
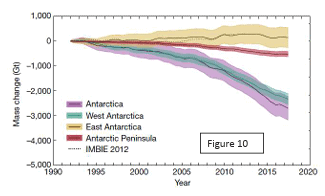
Figure 10
A common misconception is that cooling should stimulate snow while warming would reduce it. In fact, warming can increase snowfall. Snow occurs when rising moist air encounters cold air at high altitude. The poles are deserts where precipitation is rare. However, warming air can stimulate evaporation from surrounding oceans and the snow and ice sheets producing humid rising air. As this air rises, it will encounter cold air, condense out as precipitation, which then falls as snow rather than rain. This can then increase the snow and ice mass of the Eastern Antarctic.
NASA admits climate change is natural and caused by the sun
I was sufficiently intrigued by this link that I followed it. This is essentially a misrepresentation by implication. First, the subject is not the sun in terms of solar radiation trends, as the reader might expect. Rather the subject is the Milankovitch (usual spelling) Cycle which is actually three cycles. The suggestion that NASA concealed this from the public for two decades is just false. First, it was not NASA’s discovery to conceal since the Milankovitch Cycle hypothesis had been known for decades. Second, the extent to which the public did not know about it, is a measure of a failure on the part of the public to investigate the subject.
However, the story of the Milankovitch Cycle(s) is interesting. The concept was first proposed in the 1920s by Milutin Milanković the concept did not gain support as an explanation for our climate until the 1970s. The concept involves three cycles: the Eccentricity of t the Earth’s orbit around the sun referring to the shape of the orbit and Earth’s proximity to the sun comprising about a 100,000-year cycle; the Obliquity of the Ecliptic referring to the angle of the tilt comprising a 40,000-year cycle, and the Precession of the Equinoxes, referring to the rotation in the direction of the tilt comprising a 25,000-year cycle. (https://www.space.com/milankovitch cycles).
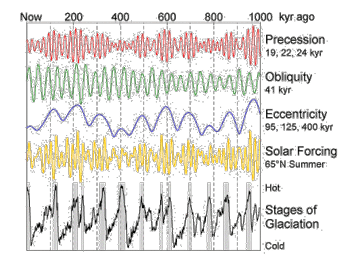
Figure 11
The influence of the cycles on the Earth’s temperature is depicted in Figure 11 (http://www.zo.utexas.edu/courses/thoc/Milankovitch_Cycles.html) where up represents warming and down represents cooling. To the Milankovitch influences are added the trend in temperature forcing from solar radiation and the stages of glacial / interglacial events. Note that the timeline runs right to left with now on the far left. These three cycles together are interpreted as being the main cause for Earth’s fluctuating between glacial and interglacial periods over the last few million years. The implication is clear: according to the combination of Milankovitch and solar radiation, our planet should now be cooling.
However, the data from a multiplicity of sources indicate unequivocally that our planet is warming (Figure 12, https://climate.nasa.gov/news/2945/nasa-noaa-analyses-reveal-2019- second-warmest-year-on-record/). The warming trend is irrefutable. Furthermore, the fact that natural forces should be causing cooling suggests that human influences have not only negated the cooling, but added warming. This implies that human activities have caused over 100% of the warming we have experienced to date.
Figure 12 Note on Rhetoric:
It’s important to recognize and beware rhetorical devices in writing, i.e., phraseology that is designed to create an impression of some perspective without actually stating it. For example, the reference to ‘whopping’ in relation to the ice extent in the Antarctic suggests an unusually large number when as Figure 8 testifies, it was actually well within historic range. Also, the statement that ‘NASA admits’ regarding climate change and the role of the sun is offered as though this is something NASA had denied yet finally acknowledged, which just isn’t so. In fact, the article is really not about the sun but the Earth’s orbital pattern; climate scientists have been well aware of this for years. Interestingly, genuine scientific writing strives to be more objective and will not exhibit these devices.